
The SPX was up 2.2% in May but only 1.2% for 2018, while the DJIA is down 1.2% through May 31, 2018. Volatile markets continue to be a feature this year compared to a placid 2017.
The trade weighted U.S. dollar index DXY has rallied from 89.18 in April to 94.11 at month's end. The dollar rallied 1.7% in May alone. It has taken a toll on returns from Emerging Markets and the EU investments.
Growth stocks continue to lead the way in 2018 and the divergence between growth and value sectors is as wide as it has been in many, many years.
Rising rates and trade tariffs are headwinds to further stock price gains. Stocks generally like a strong economy, the recent unemployment rate of 3.8% is the lowest since 1969, plus rising earnings. First quarter earnings were up more than 24% according to FactSet. Our forward P/E ratio for the S&P 500 is now 16.5 times a $165 estimate.
The P/E ratio is above the 5-year average of 16.2 and the 10-year average of 14.3, however interest rates are lower than the averages over that time frame. Share buy backs are on the rise as are dividend payments by corporations are at record levels.
The U.S. 20-year Treasury Bond ETF, TLT, is down 5.19% year to date, despite a recent rally on Euro breakup concerns. MUB, which is the iShares National MuniBond ETF, is down 1.65% in 2018.
Our assessment continues to be that we remain in a long term bull market. Stocks will likely outperform bonds this year once again. Wage inflation and core CPI will remain muted and the FED will continue to raise the Fed funds rate but not aggressively. Barring a full-blown trade war, stocks will remain in an uptrend.
At 2747 on the SPX we have rallied 51.8% off the 1810 low in February 2016. We have already had a 10% drop from the 2872 highs in January 2018, far more volatility than 2017 with a steady diet of Fed interest rate hikes.
Despite all this, stocks continue to rise having touched critical support lines several times this year and bounced higher. If earnings continue to move up and the economy expands share prices will likely rise further.
If you bought stocks in Sept, 2007, held on for 10 years through a scary period of two wars, a major recession, financial meltdown, a 50% market decline and three different presidents, stocks still retuned +7.2% annually through Sept 2107. Cash was +0.4%, 10-year treasuries +4.6%, with a CPI of +1.7%. Gold managed a +5.7% gain, while oil lost -4.3%, and home prices were down -1.0%.
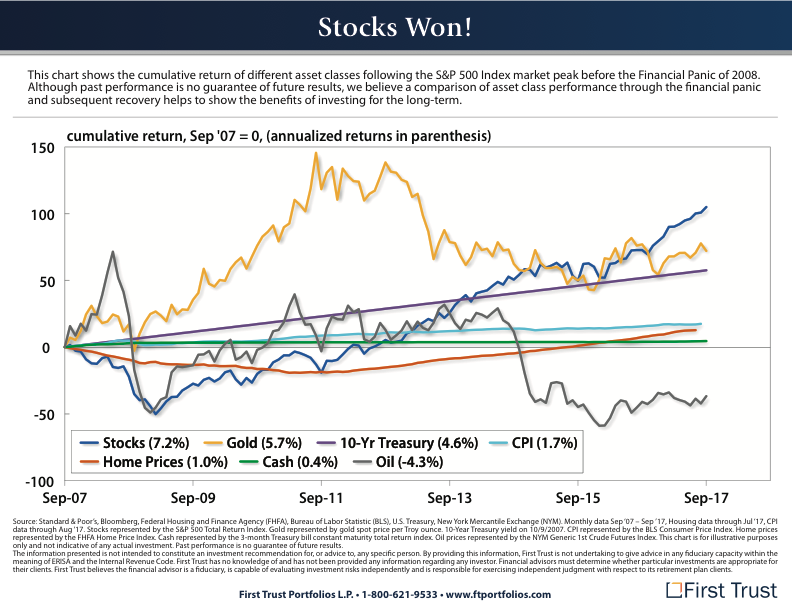
Stocks did even better over the past 90-year period with the SPX up 9.8% on average. As Yogi Berra once said, ‘It ain’t over till it’s over.”
Communication is for informational purposes only & doesn't constitute offer to sell or a solicitation of an offer to purchase any interest in any investment vehicles managed by CFA or an associated person or entity. CFA does not accept any responsibility or liability arising from the use of this communication. No representation is being made that the information presented is accurate, current, or complete, and such information is always subject to change without notice. We do not provide legal, accounting or tax advice. Any statement regarding legal, accounting or tax matters was written about the explanation of the matters described herein & not intended or written to be relied upon by any person as definitive advice. Any discussion of U.S. tax matters contained within this communication is not intended to be used and cannot be used for avoiding penalties that may be imposed under applicable Federal, state or local tax law or recommending to another party any transaction or matter addressed.


No comments:
Post a Comment